Get live statistics and analysis of 🔥 Matt Dancho (Business Science) 🔥's profile on X / Twitter

Future Is Generative AI + Data Science | Helping My Students Become Generative AI Data Scientists & AI Engineers ($200,000+ career) 👇
The Thought Leader
Matt Dancho is a passionate evangelist of the future where Generative AI meets Data Science, equipping aspiring professionals with the skills to land high-value careers. Through clear, engaging explanations and breaking news, he consistently educates and inspires a growing community. His prolific tweet activity demonstrates a dedication to spreading knowledge and shaping industry trends.
Matt’s tweet count is so high, one has to wonder if he’s single-handedly trying to out-tweet a bot—either that or he’s got a coffee IV drip for maximum output. Either way, if knowledge were measured in tweets, he’d have a PhD by now!
Successfully positioned himself as a vital resource for Generative AI and Data Science enthusiasts by breaking major industry news early and coaching students into lucrative AI careers.
To empower the next generation of AI and Data Science talent by simplifying complex technologies and highlighting emerging innovations, ensuring his followers stay ahead in a fast-evolving landscape.
Matt values education, accessibility, and the transformative power of technology. He believes in proactive adaptation to change, lifelong learning, and the democratization of cutting-edge tools to create career opportunities for many.
His strengths lie in authoritative content rooted in expertise, a large output that maintains engagement, and his ability to break down complex topics with clarity, making learning accessible and actionable.
With over 21,000 tweets, there’s a risk that some valuable insights might get lost in the volume, potentially overwhelming new followers or diluting the focus of his key messages.
To grow his audience on X, Matt should consider curating highlight threads or weekly digests to distill his prolific output, making it easier for newcomers to follow his insights without overwhelm. Also, engaging more interactively through polls, Q&As, or live discussions could deepen follower relationships.
Matt has shared critical updates about game-changing Python libraries from major tech companies like Microsoft and IBM, making him a go-to source for timely AI and Data Science innovations.
Top tweets of 🔥 Matt Dancho (Business Science) 🔥


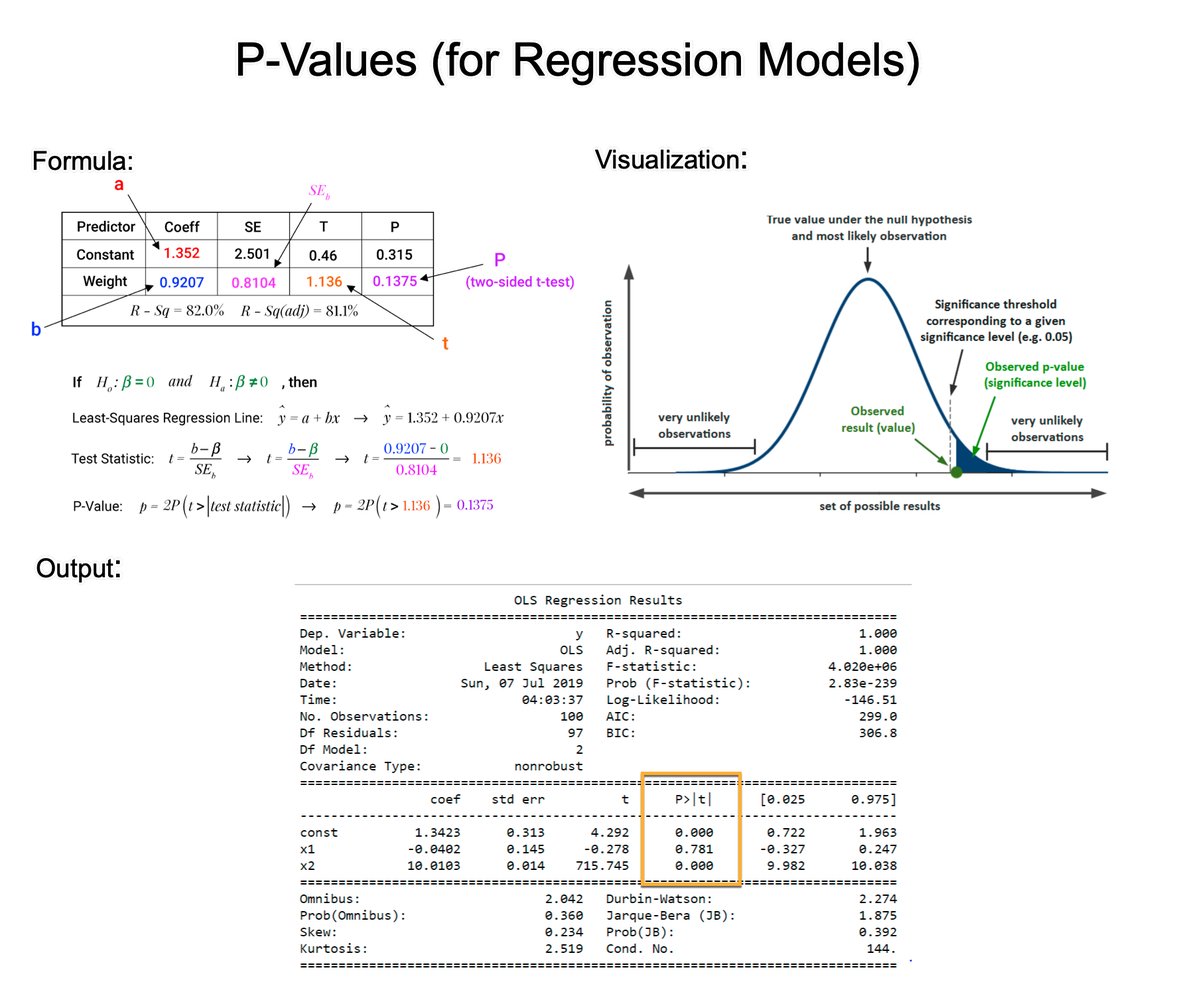
Understanding P-Values is essential for improving regression models. In 2 minutes, learn what took me 2 years to figure out. 1. The p-value: A p-value, in statistics, is a measure used to assess the strength of the evidence against a null hypothesis. 2. Null Hypothesis (H0): This is a general statement or default position that there is no relationship between two measured phenomena or no association among groups. For example, the regressor does not affect the outcome. 3. Alternative Hypothesis (H1): This is what you want to test for. It is often the opposite of the null hypothesis. For example, that the regressor does affect the outcome. 4. Calculating the p-value: The p-value for each coefficient is typically calculated using the t-test. There are several steps involved. Let's break them down. 5. Coefficient Estimate: In a regression model, you have estimates of coefficients (β) for each predictor. These coefficients represent the change in the dependent variable for a one-unit change in the predictor, holding all other predictors constant. 6. Standard Error of the Coefficient: The standard error (SE) measures the accuracy with which a sample represents a population. In regression, the SE of a coefficient estimate indicates how much variability there is in the estimate of the coefficient. 7. Test Statistic (T): The test statistic for each coefficient in a regression model is calculated by dividing the Coefficient Estimate / Standard Error of the Coefficient. This gives you a t-value. 8. Degrees of Freedom: The degrees of freedom (df) for this test are usually calculated as the number of observations minus the number of parameters being estimated (including the intercept). 9. P-Value Calculation: The p-value is then determined by comparing the calculated t-value to the t-distribution with the appropriate degrees of freedom. The area under the t-distribution curve, beyond the calculated t-value, gives the p-value. 10. Interpretation: A small p-value (usually ≤ 0.05) indicates that it is unlikely to observe such a data pattern if the null hypothesis were true, suggesting that the predictor is a significant contributor to the model. === Ready to learn Data Science for Business? I put together a free on-demand workshop that covers the 10 skills that helped me make the transition to Data Scientist: learn.business-science.io/free-rtrack-ma… And if you'd like to speed it up, I have a live workshop next week where I'll share how to use ChatGPT for Data Science: learn.business-science.io/registration-c… If you like this post, please reshare ♻️ it so others can get value.


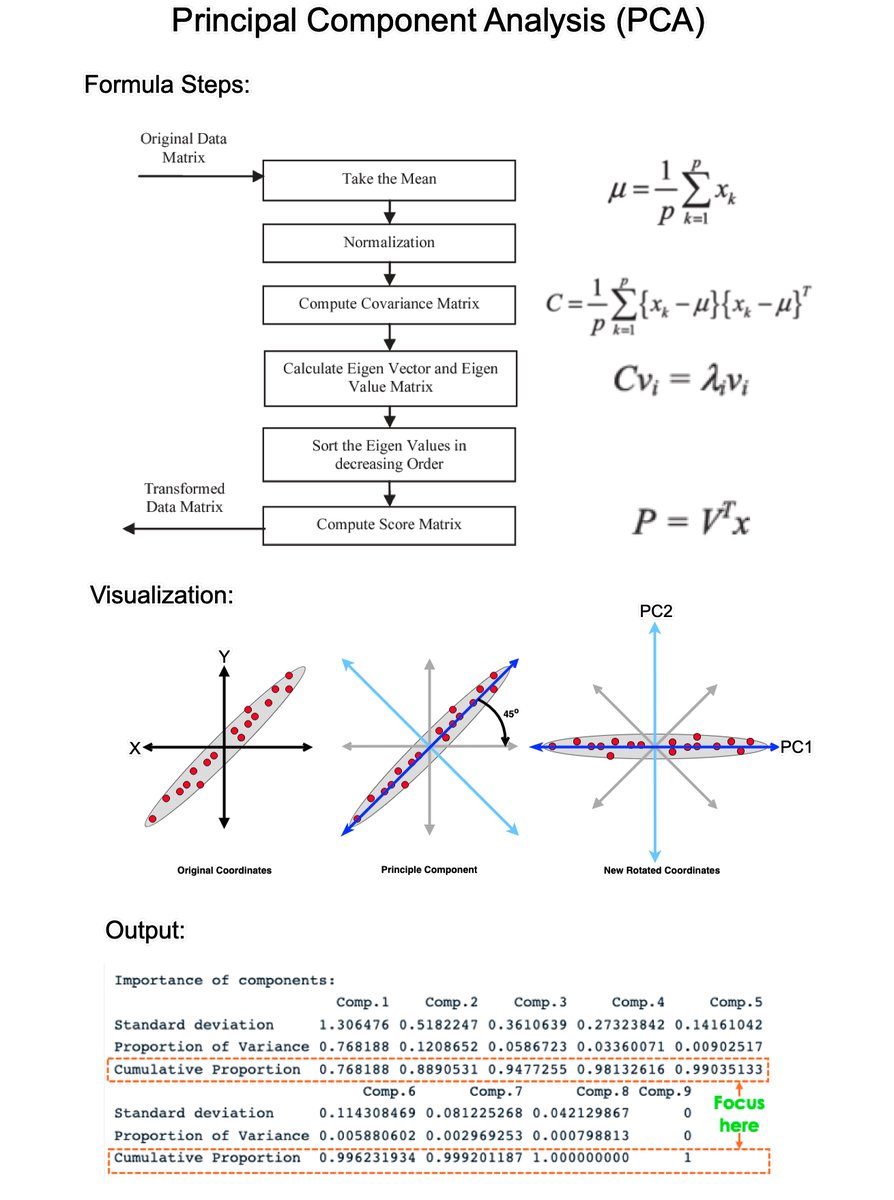
Principal Component Analysis (PCA) is the gold standard in dimensionality reduction with uses in business. In 5 minutes, I'll teach you what took me 5 weeks. Let's go! 1. What is PCA?: PCA is a statistical technique used in data analysis, mainly for dimensionality reduction. It's beneficial when dealing with large datasets with many variables, and it helps simplify the data's complexity while retaining as much variability as possible. 2. How PCA Works: PCA has 5 steps; Standardization, Covariance Matrix Computation, Eigen Vector Calculation, Choosing Principal Components, and Transforming the data. 3. Standardization: The first step in PCA is to standardize the data. Since the scale of the data influences PCA, standardizing the data (giving it mean of 0 and variance of 1) ensures that the analysis is not biased towards variables with greater magnitude. 4. Covariance Matrix Computation: PCA looks at the variance and the covariance of the data. Variance is a measure of the variability of a single feature, and covariance is a measure of how much two features change together. The covariance matrix is a table where each element represents the covariance between two features. 5. Eigenvalue and Eigenvector Calculation: From the covariance matrix, eigenvalues and eigenvectors are calculated. Eigenvectors are the directions of the axes where there is the most variance (i.e., the principal components), and eigenvalues are coefficients attached to eigenvectors that give the amount of variance carried in each Principal Component. 6. Choosing Principal Components: The eigenvectors are sorted by their eigenvalues in descending order. This gives the components in order of significance. Here, you decide how many principal components to keep. This is often based on the cumulative explained variance ratio, which is the amount of variance explained by each of the selected components. 7. Transforming Data: Finally, the original data is projected onto the principal components (eigenvectors) to transform the data into a new space. This results in a new dataset where the variables are uncorrelated and where the first few variables retain most of the variability of the original data. 8. Evaluation: Each PCA component accounts for a certain amount of the total variance in a dataset. The cumulative proportion of variance explained is just the cumulative sum of each PCA's variance explained. Often this is plotted on a Scree plot with Top N PCA components. ==== Ready to learn Data Science for Business? I put together a free on-demand workshop that covers the 10 skills that helped me make the transition to Data Scientist: learn.business-science.io/free-rtrack-ma… And if you'd like to speed it up, I have a live workshop next week where I'll share how to use ChatGPT for Data Science: learn.business-science.io/registration-c… If you like this post, please reshare ♻️ it so others can get value.
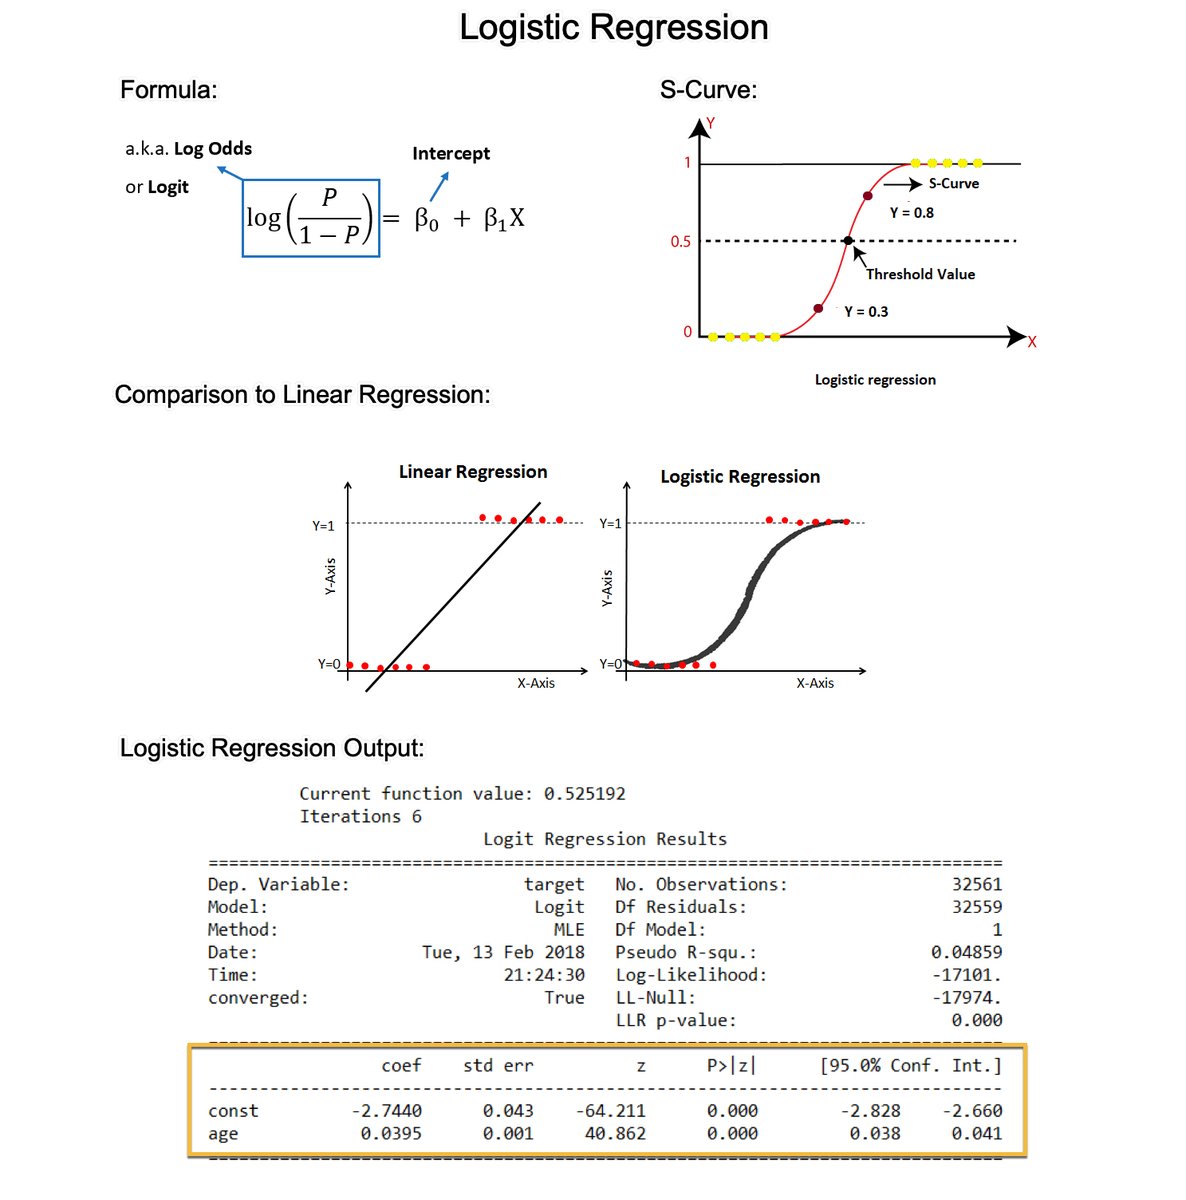
Logistic Regression is the most important foundational algorithm in Classification Modeling. In 2 minutes, I'll teach you what took me 2 months to learn. Let's dive in: 1. Logistic regression is a statistical method used for analyzing a dataset in which there are one or more independent variables that determine a binary outcome (in which there are only two possible outcomes). This is commonly called a binary classification problem. 2. The Logit (Log-Odds): The formula estimates the log-odds or logit. The right-hand side is the same as the form for linear regression. But the left-hand side is the logit function, which is the natural log of the odds ratio. The logit function is what distinguishes logistic regression from other types of regression. 3. The S-Curve: Logistic regression uses a sigmoid (or logistic) function to model the data. This function maps any real-valued number into a value between 0 and 1, making it suitable for a probability estimation. This is where the S-curve shape comes in. 4. Why not Linear Regression? The shape of the S-curve often fits the binary outcome better than a linear regression. Linear regression assumes the relationship is linear, which often does not hold for binary outcomes, where the relationship between the independent variables and the probability of the outcome is typically not linear but sigmoidal (S-shaped). 5. Coefficient Estimation: Like linear regression, logistic regression calculates coefficients for each independent variable. However, these coefficients are in the log-odds scale. 6. Coefficient Interpretation (Log-Odds to Odds): Exponentiating a coefficient converts it from log odds to odds. For example, if a coefficient is 0.5, the odds ratio is exp(0.5), which is approximately 1.65. This means that with a one-unit increase in the predictor, the odds of the outcome increase by a factor of 1.65. 7. Model evaluation: The evaluation metrics for linear regression (like R-squared) are not suitable for assessing the performance of a model in a classification context. For Logistic regression, I normally use classification-specific evaluation metrics like AUC, precision, recall, F1 score, ROC curve, etc. === Ready to learn Data Science for Business? I put together a free on-demand workshop that covers the 10 skills that helped me make the transition to Data Scientist: learn.business-science.io/free-rtrack-ma… And if you'd like to speed it up, I have a live workshop next week where I'll share how to use ChatGPT for Data Science: learn.business-science.io/registration-c…
Understanding P-Values is essential for improving regression models. In 2 minutes, learn what took me 2 years to figure out. 1. The p-value: A p-value, in statistics, is a measure used to assess the strength of the evidence against a null hypothesis. 2. Null Hypothesis (H0): This is a general statement or default position that there is no relationship between two measured phenomena or no association among groups. For example, the regressor does not affect the outcome. 3. Alternative Hypothesis (H1): This is what you want to test for. It is often the opposite of the null hypothesis. For example, that the regressor does affect the outcome. 4. Calculating the p-value: The p-value for each coefficient is typically calculated using the t-test. There are several steps involved. Let's break them down. 5. Coefficient Estimate: In a regression model, you have estimates of coefficients (β) for each predictor. These coefficients represent the change in the dependent variable for a one-unit change in the predictor, holding all other predictors constant. 6. Standard Error of the Coefficient: The standard error (SE) measures the accuracy with which a sample represents a population. In regression, the SE of a coefficient estimate indicates how much variability there is in the estimate of the coefficient. 7. Test Statistic (T): The test statistic for each coefficient in a regression model is calculated by dividing the Coefficient Estimate / Standard Error of the Coefficient. This gives you a t-value. 8. Degrees of Freedom: The degrees of freedom (df) for this test are usually calculated as the number of observations minus the number of parameters being estimated (including the intercept). 9. P-Value Calculation: The p-value is then determined by comparing the calculated t-value to the t-distribution with the appropriate degrees of freedom. The area under the t-distribution curve, beyond the calculated t-value, gives the p-value. 10. Interpretation: A small p-value (usually ≤ 0.05) indicates that it is unlikely to observe such a data pattern if the null hypothesis were true, suggesting that the predictor is a significant contributor to the model. There you have it- my top 10 concepts on p-values. The next problem you'll face is how to apply data science to business. I'd like to help. I’ve spent 100 hours consolidating my learnings into a free 5-day course, How to Solve Business Problems with Data Science. It comes with: 300+ lines of R and Python code 5 bonus trainings 2 systematic frameworks 1 complete roadmap to avoid mistakes and start solving business problems with data science, TODAY. 👉 Here it is for free: learn.business-science.io/free-solve-bus…

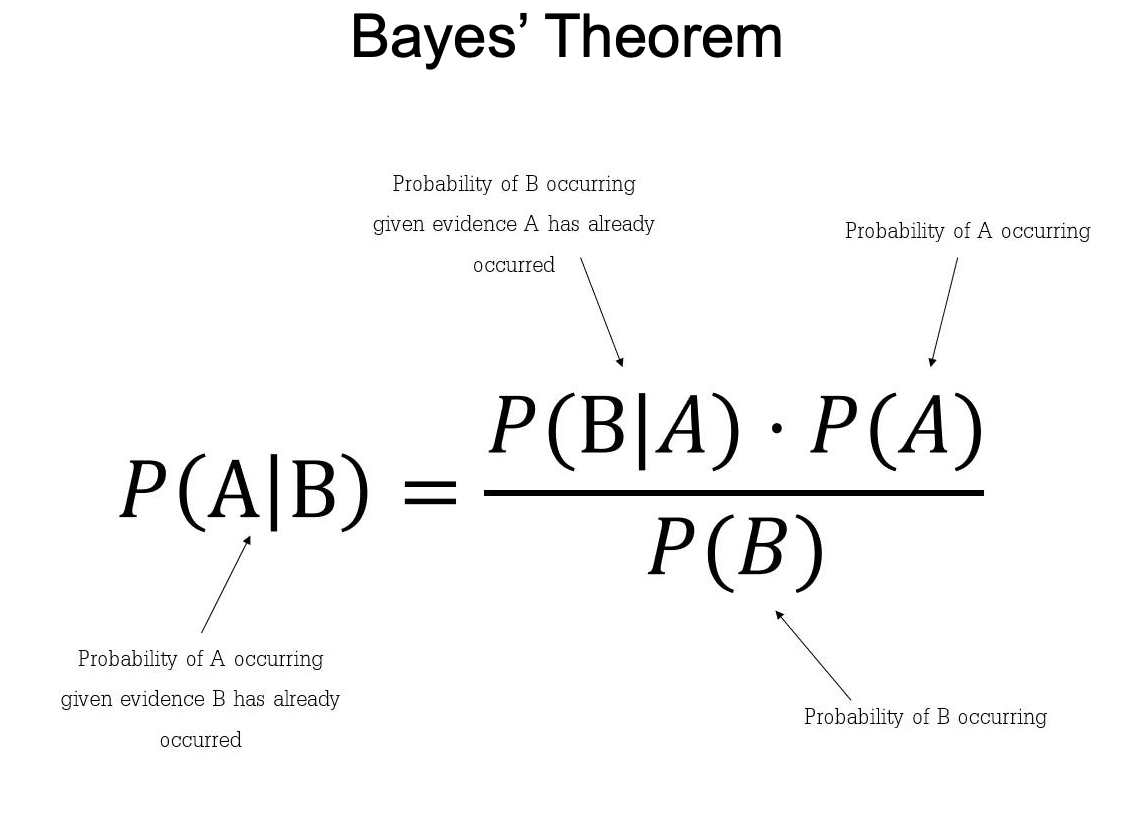
Bayes' Theorem is a fundamental concept in data science. But it took me 2 years to understand its importance. In 2 minutes, I'll share my best findings over the last 2 years exploring Bayesian Statistics. Let's go. 1. Background: "An Essay towards solving a Problem in the Doctrine of Chances," was published in 1763, two years after Bayes' death. In this essay, Bayes addressed the problem of inverse probability, which is the basis of what is now known as Bayesian probability. 2. Bayes' Theorem: Bayes' Theorem provides a mathematical formula to update the probability for a hypothesis as more evidence or information becomes available. It essentially describes how to revise existing predictions or theories in light of new evidence, a process known as Bayesian inference. 3. Bayesian Statistics: Bayesian Statistics is an approach to statistics that interprets probability as a measure of belief or certainty rather than just a frequency. This belief may be based on prior knowledge of the conditions that might be related to the event or experiment in question. This allows for making probabilistic statements about unknown parameters. For instance, instead of estimating a single value for a parameter, Bayesian statistics provides a distribution of possible values, reflecting the uncertainty. 4. Bayesian vs Frequentist: Bayesian inference is fundamentally about updating beliefs or probabilities as new data is observed, which can be very intuitive and aligns with how we often think about the world. Frequentist statistics interpret probability as the long-run frequency of events. The problem I have with frequentist approaches is that pre-determined distributions are used (e.g. Normal Gaussian), which does not always make sense. 5. Bayesian Machine Learning: Any time true confidence and probabilistic decision making is needed, Bayesian is the answer. Here are a couple of examples. Uncertainty Modeling: Unlike traditional machine learning methods that often provide point estimates, Bayesian methods focus on estimating distributions. Time-Series Analysis: Bayesian methods are particularly useful in time-series analysis, where uncertainty in the future is crucial. 6. Business Context: Businesses can use Bayes' Theorem to assess and quantify various risks, such as market risks, credit risks, or operational risks. By continuously updating the probability of risks as new information emerges, businesses can make more informed decisions. === Ready to learn Data Science for Business? I put together a free on-demand workshop that covers the 10 skills that helped me make the transition to Data Scientist: learn.business-science.io/free-rtrack-ma… And if you'd like to speed it up, I have a live workshop where I'll share how to use ChatGPT for Data Science: learn.business-science.io/registration-c… If you like this post, please reshare ♻️ it so others can get value.

Most engaged tweets of 🔥 Matt Dancho (Business Science) 🔥


Understanding P-Values is essential for improving regression models. In 2 minutes, learn what took me 2 years to figure out. 1. The p-value: A p-value, in statistics, is a measure used to assess the strength of the evidence against a null hypothesis. 2. Null Hypothesis (H0): This is a general statement or default position that there is no relationship between two measured phenomena or no association among groups. For example, the regressor does not affect the outcome. 3. Alternative Hypothesis (H1): This is what you want to test for. It is often the opposite of the null hypothesis. For example, that the regressor does affect the outcome. 4. Calculating the p-value: The p-value for each coefficient is typically calculated using the t-test. There are several steps involved. Let's break them down. 5. Coefficient Estimate: In a regression model, you have estimates of coefficients (β) for each predictor. These coefficients represent the change in the dependent variable for a one-unit change in the predictor, holding all other predictors constant. 6. Standard Error of the Coefficient: The standard error (SE) measures the accuracy with which a sample represents a population. In regression, the SE of a coefficient estimate indicates how much variability there is in the estimate of the coefficient. 7. Test Statistic (T): The test statistic for each coefficient in a regression model is calculated by dividing the Coefficient Estimate / Standard Error of the Coefficient. This gives you a t-value. 8. Degrees of Freedom: The degrees of freedom (df) for this test are usually calculated as the number of observations minus the number of parameters being estimated (including the intercept). 9. P-Value Calculation: The p-value is then determined by comparing the calculated t-value to the t-distribution with the appropriate degrees of freedom. The area under the t-distribution curve, beyond the calculated t-value, gives the p-value. 10. Interpretation: A small p-value (usually ≤ 0.05) indicates that it is unlikely to observe such a data pattern if the null hypothesis were true, suggesting that the predictor is a significant contributor to the model. === Ready to learn Data Science for Business? I put together a free on-demand workshop that covers the 10 skills that helped me make the transition to Data Scientist: learn.business-science.io/free-rtrack-ma… And if you'd like to speed it up, I have a live workshop next week where I'll share how to use ChatGPT for Data Science: learn.business-science.io/registration-c… If you like this post, please reshare ♻️ it so others can get value.

Principal Component Analysis (PCA) is the gold standard in dimensionality reduction with uses in business. In 5 minutes, I'll teach you what took me 5 weeks. Let's go! 1. What is PCA?: PCA is a statistical technique used in data analysis, mainly for dimensionality reduction. It's beneficial when dealing with large datasets with many variables, and it helps simplify the data's complexity while retaining as much variability as possible. 2. How PCA Works: PCA has 5 steps; Standardization, Covariance Matrix Computation, Eigen Vector Calculation, Choosing Principal Components, and Transforming the data. 3. Standardization: The first step in PCA is to standardize the data. Since the scale of the data influences PCA, standardizing the data (giving it mean of 0 and variance of 1) ensures that the analysis is not biased towards variables with greater magnitude. 4. Covariance Matrix Computation: PCA looks at the variance and the covariance of the data. Variance is a measure of the variability of a single feature, and covariance is a measure of how much two features change together. The covariance matrix is a table where each element represents the covariance between two features. 5. Eigenvalue and Eigenvector Calculation: From the covariance matrix, eigenvalues and eigenvectors are calculated. Eigenvectors are the directions of the axes where there is the most variance (i.e., the principal components), and eigenvalues are coefficients attached to eigenvectors that give the amount of variance carried in each Principal Component. 6. Choosing Principal Components: The eigenvectors are sorted by their eigenvalues in descending order. This gives the components in order of significance. Here, you decide how many principal components to keep. This is often based on the cumulative explained variance ratio, which is the amount of variance explained by each of the selected components. 7. Transforming Data: Finally, the original data is projected onto the principal components (eigenvectors) to transform the data into a new space. This results in a new dataset where the variables are uncorrelated and where the first few variables retain most of the variability of the original data. 8. Evaluation: Each PCA component accounts for a certain amount of the total variance in a dataset. The cumulative proportion of variance explained is just the cumulative sum of each PCA's variance explained. Often this is plotted on a Scree plot with Top N PCA components. ==== Ready to learn Data Science for Business? I put together a free on-demand workshop that covers the 10 skills that helped me make the transition to Data Scientist: learn.business-science.io/free-rtrack-ma… And if you'd like to speed it up, I have a live workshop next week where I'll share how to use ChatGPT for Data Science: learn.business-science.io/registration-c… If you like this post, please reshare ♻️ it so others can get value.

People with Thought Leader archetype
Founder baked.design | ex @Meta | Let’s talk cal.com/baked/30min | dealhunt.cc | delegatoo.com
CTO of I³D Technology Inc. Blog: samtsai.org WorkFlowy: workflowy.tips , buymeacoffee.com/samtsai Newsletter: thecpp.news 🚭
FullStack TypeScript Developer
Managing Partner en @500GlobalVC, @500latam. Newsletter, Podcasts, Info en: santiagozavala.com
the business of creativity @openpurpose
i make things on the internet
I build voice and text AI assistants that cut response time to 2 mins and auto-book appointments. Mostly powered by Twilio + OpenAI. gonzalo@ggomez.dev
Software Developer 👑 Husband of a queen, dad to 2 princesses. Passion for coding, family, and constant growth.
I talk about marketing & internet businesses a lot. 1.5m subs on YouTube, 100m+ views across social. Running makluinitiative.com
Building software that solve real problems ☁️ skyclouds.co – Deep tech startup
快人一步,专业又深度的财经资讯。
ML @thred_ai | prev eng DoD
Explore Related Archetypes
If you enjoy the thought leader profiles, you might also like these personality types: