Get live statistics and analysis of Concretum Research's profile on X / Twitter

We swing and trade intraday US markets exploiting statistical edges. We investigate the effect of demand/supply imbalance across time-frames and asset-classes
The Analyst
Concretum Research is a data-driven, deeply analytical profile specializing in statistically-backed insights and quantitative trading strategies in US intraday markets. With a focus on rigorous research, their content delivers sophisticated financial investigations, enriched by academic collaborations and accessible coding tools for traders. They thrive on transforming complex market phenomena into actionable strategies, bridging the gap between theory and practice.
Concretum Research tweets enough academic papers and code to make a PhD student blush—it's like financial markets met the library and decided to write a love letter nobody without a master’s degree can fully read (but hey, at least they made the code 'simple'... sort of).
Their most impressive achievement to date is the publication of widely read, peer-recognized papers on trading profitability and trend-following strategies that have influenced over 30,000 readers, supported by publicly released, user-friendly research code.
Their life purpose is to demystify the complexities of financial markets through rigorous empirical research, empowering traders and quantitatively minded investors to make smarter, evidence-based decisions.
They hold a strong belief in transparency, reproducibility, and the power of well-founded, statistical analysis over speculation or anecdotal trading advice. They value academic collaboration, continuous learning, and practical applications of research that improve trading outcomes.
Concretum Research’s biggest strength lies in their meticulous, data-centric approach coupled with clear communication that connects high-level quant research with accessible tools, appealing to both experts and aspiring traders.
Their highly technical and research-heavy style might deter casual traders or broader audiences who seek quick, digestible market tips instead of deep dives into statistical nuances.
To grow their audience on X, they should consider blending their rigorous research with more frequent, simplified micro-content—like quick insights, charts, and thread explainers—tailored for traders who crave expert knowledge but appreciate bite-sized, actionable takeaways.
Fun fact: Concretum not only publishes cutting-edge research but also releases Python code that even non-programmers can use to backtest trading strategies—making advanced trading a little less mysterious and a lot more inclusive.
Top tweets of Concretum Research

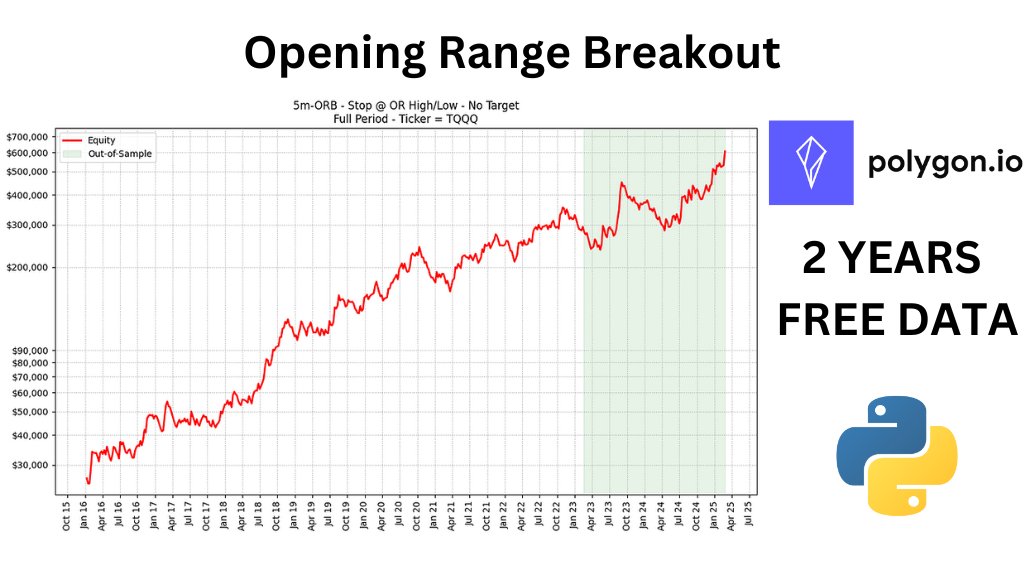
We are excited to announce that we have just published the Python code to replicate our most-read paper, "Can Day Trading Really Be Profitable?", co-authored with @BearBullTraders in 2023 and read by more than 30,000 people. This code allows users—even those with no programming experience—to backtest the 5-minute Opening Range Breakout strategy on different tickers or with alternative position management approaches. While the model described in the paper has shown profitability, it is far from being a fully developed trading system. Incorporating filters to avoid trading in noisy market conditions can significantly improve the hit ratio and profitability while reducing trading costs—we leave this challenge to the most ambitious traders. You can find the link below 👇👇 A special thanks to our talented software engineer, @M_S_Gabriel, for converting our original Matlab version into Python and writing this article!
After weeks of research, we are excited to share the release of our latest paper on SSRN: Does Trend Following Still Work on Stocks? While trend-following strategies have been widely studied and traded in futures markets, equity markets have seen comparatively less empirical investigation. One of the few significant contributions to this field was published in 2005 by Cole Wilcox and Eric Crittenden. Building on their foundational work, our research takes a deeper dive, extending the analysis with historical data from 1950 through late 2024. Additionally, our paper addresses the practical challenges faced by highly diversified stock programs, including position sizing and strategies to minimize transaction costs. You can read the first version of the paper here: bit.ly/TrendStocks A sincere thanks to my co-author Alberto Pagani and @ColeWilcoxCIO for their invaluable insights and support throughout this journey. A special thanks also to @M_S_Gabriel and Richard Dale from @NorgateData for their essential database support.
A few months ago, I decided to embark on a new and fascinating research project—one that is, in many ways, doubly connected to the early stages of my career in financial markets. First, because my co-author is prof Antonio Mele, who was my thesis advisor during my Quant Finance master’s at USI back in 2013. And second, because the topic is volatility investing—my core research focus during my time at BlackRock. Given the range of insights and findings, this project may eventually result in two separate publications. The first paper explores episodes of Knightian uncertainty—situations in which probability distributions become unknown and traditional financial models break down. These episodes tend to amplify investors’ ambiguity aversion, causing the uncertainty premium to spike. The result is often a severe initial market downturn, with asset prices overshooting on the downside. The second paper should be designed as a practical compendium of short-term trading strategies for VIX Futures—covering themes like carry, momentum, event-driven signals, and intraday edges. Plenty of exciting projects underway here at @ConcretumR. Wishing you all a relaxing Easter break!


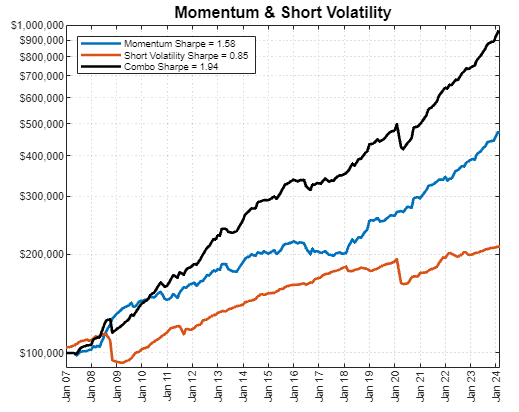
Just before taking a few weeks of holiday in the lovely Sardinia, I’m pleased to announce that we’ve just released a new research paper: The Volatility Edge – A Dual Approach for VIX ETNs Trading Coauthored with Prof. Antonio Mele and @BearBullTraders , this paper introduces readers to the world of volatility trading—long considered the playground of highly sophisticated systematic institutions. Thanks to the emergence of liquid VIX ETNs and major advances in broker APIs, retail and semi-professional investors can now access the volatility risk premium using simple yet effective tools. In this paper, after outlining the history of volatility trading, the instruments involved, and the main empirical findings in accessible terms, we present a dual-signal strategy for timing volatility markets through a daily-rebalanced portfolio of two liquid ETNs. From 2008 to 2025, the strategy delivered: 📈 CAGR: 16.3% 📊 Sharpe Ratio: 1.00 📉 Max Drawdown (adj): –12% 🔍 Alpha vs S&P 500: 15% ⚖️ Beta to S&P 500: just 0.12 As a bonus, our automation expert Mohamed Gabriel has written a dedicated section with a complete Python notebook that automates the strategy via the Interactive Brokers API. In the coming days, we’ll also release the audio version of the paper and a companion Notebook LM podcast—both approved by the authors. You can read the full paper from the 🔗 in the comments We hope you enjoy it—and as always, feel free to reach out at carlo@concretumgroup.com with any questions or feedback!


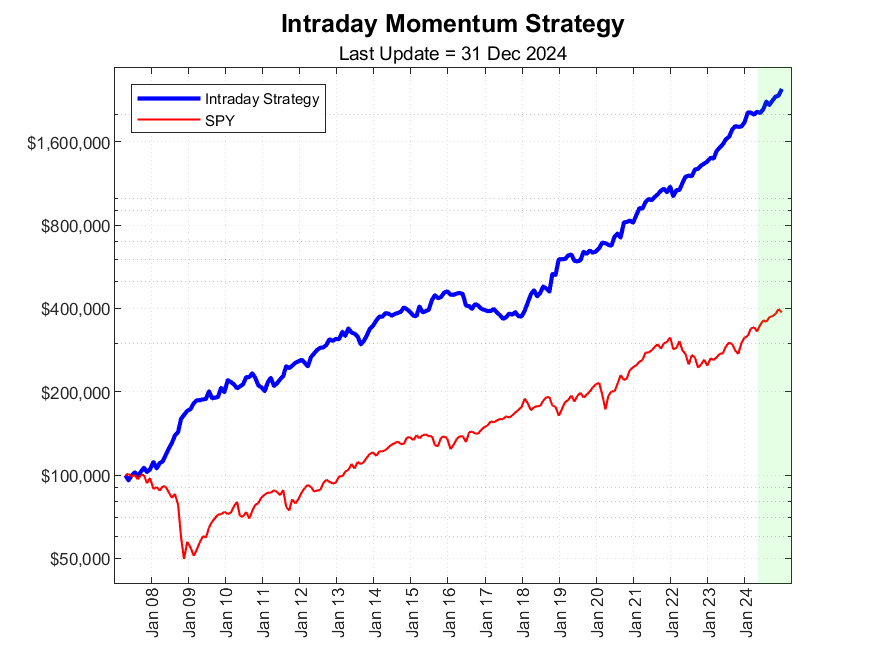
Intraday Trend-Following Update: 2024 Results In December, our intraday trend-following program on SPY gained another +5.70%, compounding previous months’ returns and bringing the overall net profit for the year to +32.20%. The green area in the chart highlights the period following the publication of our paper. These results are even more impressive given that, over the last 12 months, the strategy’s beta vs. the market was -0.15 while the S&P 500 advanced by +26%. Another key feature of our intraday trend model is its ability to quickly shift from long to short, effectively riding the largest intraday moves. This creates a powerful convex relationship relative to a passive holding—meaning the strategy becomes more effective as the market’s daily moves grow larger. Pairing a passive long-term exposure with an active intraday solution can significantly enhance a portfolio’s risk-reward profile. We’ve just updated our paper on SSRN with performance data through December 31, 2024. We also added two new FAQs: ✔️How does the average trade profitability change over the years? ✔️How do the results change if we only use VWAP as a trailing stop? We encourage you to explore these FAQs for valuable insights on strengthening the strategy’s effectiveness and robustness. Read the full paper here --> bit.ly/BeatTheMarketS… For any questions, feel free to DM or email me at carlo@concretumgroup.com @BearBullTraders @Andrea_Barbon

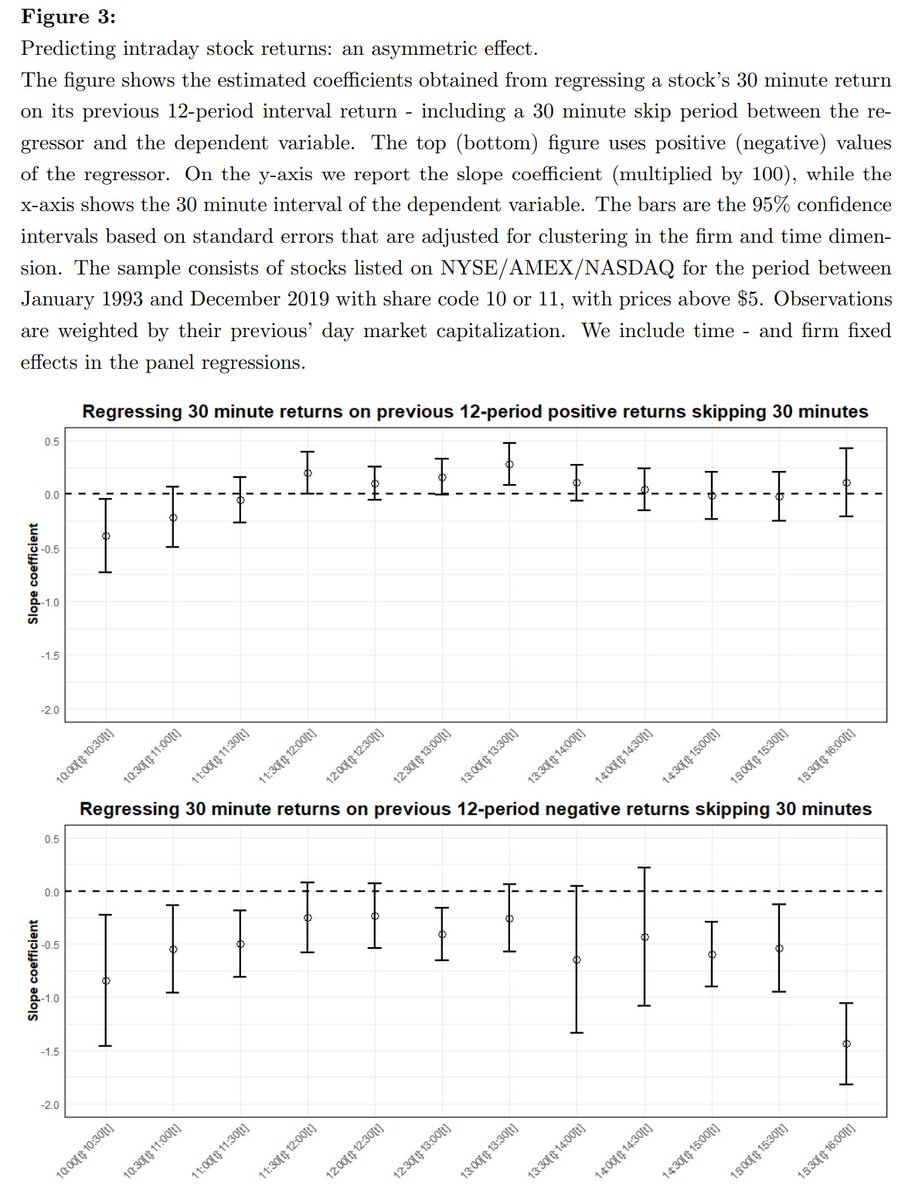
** Exploiting Intraday Reversal in US Markets ** A recent study by @BaltussenGuido titled "End-of-Day Reversal", highlights a significant tendency for stocks to experience price reversals during the final 30 minutes of the trading session. This pattern is particularly pronounced for stocks that have undergone large intraday sell-offs. The authors explore various possible explanations and point to two likely drivers behind this phenomenon: 1. Retail Investors Engaging in "Buy-the-Dip" Trading When a stock's price drops earlier in the day, retail investors often jump in during the final hours of trading, hoping for a quick rebound. This surge in buying activity can push the price back up, contributing to the reversal. 2. Reduced Short-Selling Activity Towards the End of the Day Short-sellers, who profit when stock prices decline, are more cautious about opening new short positions late in the day due to the risk of an overnight price increase. This reduction in selling pressure, combined with retail buying, can further amplify the upward price movement. The study also highlights an intriguing contrast between market indexes and individual stocks. While market indexes tend to exhibit intraday momentum, individual stocks display a distinct reversal pattern. This apparent contradiction arises from strong cross-autocorrelations among individual stocks. In simpler terms, stocks that haven't moved as much during the day tend to "catch up" in the final 30 minutes, resulting in the end-of-day reversal (I still need to fully grasp this point myself!). Although the paper does not outline a specific trading strategy, it lays a valuable academic foundation for further research and the development of sophisticated trading programs. Many ideas are running through my mind—this could potentially be the focus of a new research project in 2025. Here’s the link to the working paper: bit.ly/EoDReversal
In recent years, we’ve seen the emergence of many products designed to enhance a passive 100% equity exposure with an active, systematic strategy layered on top. Many of these products rely on classic trend-following indexes, whose hedging capabilities have proven effective during key historical periods of market turmoil. However, this hedging property is not inherent by design. In some cases, what you expect to be your hedging ally can turn into your worst enemy. This was particularly evident earlier this year, when SPY sharply declined while most CTA programs were also fully long equities. The result? On top of SPY’s 20% drawdown, you had to endure an additional 10% drop from the CTA exposure. Painful! While we firmly believe in the value of including classic trend-following programs within a diversified portfolio (as outlined in many of our previous papers), our ideal SPY-stacked portfolio would incorporate a higher-frequency trend model on SPY. By design, this model is much more responsive and better aligned with what we consider a true equity hedge. We’ve created an animated version of the hypothetical NAV trajectory for a portfolio composed of 100% SPY plus a variable allocation to an intraday trend model on SPY. The benefits are remarkable! While these strategies do have lower capacity, they can significantly enhance risk-adjusted returns if implemented at the right size and with proper execution. Today, this is easier than ever to accomplish thanks to the APIs offered by many well-known brokerage platforms. For more details about the underlying strategy used in this example, check out our 2024 paper “Beat the Market”, co-authored with @BearBullTraders and @Andrea_Barbon from the Swiss Finance Institute. More info in comments. 📬 If you have questions feel free to reach out at carlo@concretumgroup.com
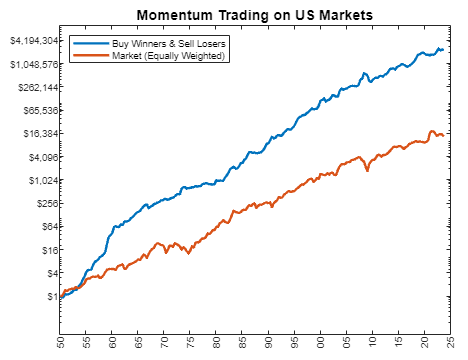
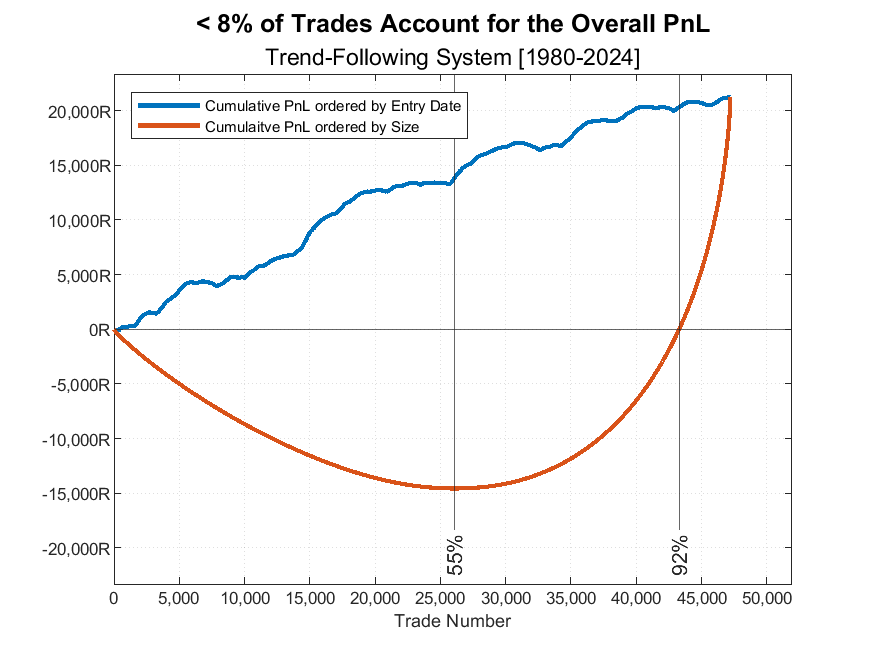
We're currently working on an insightful research project testing the profitability of a trend-following system in the US stock market. Using a comprehensive, bias-free database from @NorgateData, we've assessed whether there's an edge in buying stocks at all-time highs and holding them until a volatility-based trailing stop is triggered. Our findings align with @ColeWilcoxCIO and Crittenden 2005 study, confirming the existence of an exploitable edge, though it appears to be diminishing. Since 1980, our backtest shows that out of 47,000 trades... 55% resulted in a loss, 37% recouped these losses <8% accounted for the strategy's entire profitability. This mirrors the trade distribution seen in trend-following futures strategies, where infrequent but highly profitable trades can turn an average year into a great one. We'll be sharing more results soon. If you've run your own backtest on trend systems for stocks and want to share your results, feel free to drop us a message!
Most engaged tweets of Concretum Research
We are excited to announce that we have just published the Python code to replicate our most-read paper, "Can Day Trading Really Be Profitable?", co-authored with @BearBullTraders in 2023 and read by more than 30,000 people. This code allows users—even those with no programming experience—to backtest the 5-minute Opening Range Breakout strategy on different tickers or with alternative position management approaches. While the model described in the paper has shown profitability, it is far from being a fully developed trading system. Incorporating filters to avoid trading in noisy market conditions can significantly improve the hit ratio and profitability while reducing trading costs—we leave this challenge to the most ambitious traders. You can find the link below 👇👇 A special thanks to our talented software engineer, @M_S_Gabriel, for converting our original Matlab version into Python and writing this article!
We're currently working on an insightful research project testing the profitability of a trend-following system in the US stock market. Using a comprehensive, bias-free database from @NorgateData, we've assessed whether there's an edge in buying stocks at all-time highs and holding them until a volatility-based trailing stop is triggered. Our findings align with @ColeWilcoxCIO and Crittenden 2005 study, confirming the existence of an exploitable edge, though it appears to be diminishing. Since 1980, our backtest shows that out of 47,000 trades... 55% resulted in a loss, 37% recouped these losses <8% accounted for the strategy's entire profitability. This mirrors the trade distribution seen in trend-following futures strategies, where infrequent but highly profitable trades can turn an average year into a great one. We'll be sharing more results soon. If you've run your own backtest on trend systems for stocks and want to share your results, feel free to drop us a message!
Just before taking a few weeks of holiday in the lovely Sardinia, I’m pleased to announce that we’ve just released a new research paper: The Volatility Edge – A Dual Approach for VIX ETNs Trading Coauthored with Prof. Antonio Mele and @BearBullTraders , this paper introduces readers to the world of volatility trading—long considered the playground of highly sophisticated systematic institutions. Thanks to the emergence of liquid VIX ETNs and major advances in broker APIs, retail and semi-professional investors can now access the volatility risk premium using simple yet effective tools. In this paper, after outlining the history of volatility trading, the instruments involved, and the main empirical findings in accessible terms, we present a dual-signal strategy for timing volatility markets through a daily-rebalanced portfolio of two liquid ETNs. From 2008 to 2025, the strategy delivered: 📈 CAGR: 16.3% 📊 Sharpe Ratio: 1.00 📉 Max Drawdown (adj): –12% 🔍 Alpha vs S&P 500: 15% ⚖️ Beta to S&P 500: just 0.12 As a bonus, our automation expert Mohamed Gabriel has written a dedicated section with a complete Python notebook that automates the strategy via the Interactive Brokers API. In the coming days, we’ll also release the audio version of the paper and a companion Notebook LM podcast—both approved by the authors. You can read the full paper from the 🔗 in the comments We hope you enjoy it—and as always, feel free to reach out at carlo@concretumgroup.com with any questions or feedback!
After weeks of research, we are excited to share the release of our latest paper on SSRN: Does Trend Following Still Work on Stocks? While trend-following strategies have been widely studied and traded in futures markets, equity markets have seen comparatively less empirical investigation. One of the few significant contributions to this field was published in 2005 by Cole Wilcox and Eric Crittenden. Building on their foundational work, our research takes a deeper dive, extending the analysis with historical data from 1950 through late 2024. Additionally, our paper addresses the practical challenges faced by highly diversified stock programs, including position sizing and strategies to minimize transaction costs. You can read the first version of the paper here: bit.ly/TrendStocks A sincere thanks to my co-author Alberto Pagani and @ColeWilcoxCIO for their invaluable insights and support throughout this journey. A special thanks also to @M_S_Gabriel and Richard Dale from @NorgateData for their essential database support.
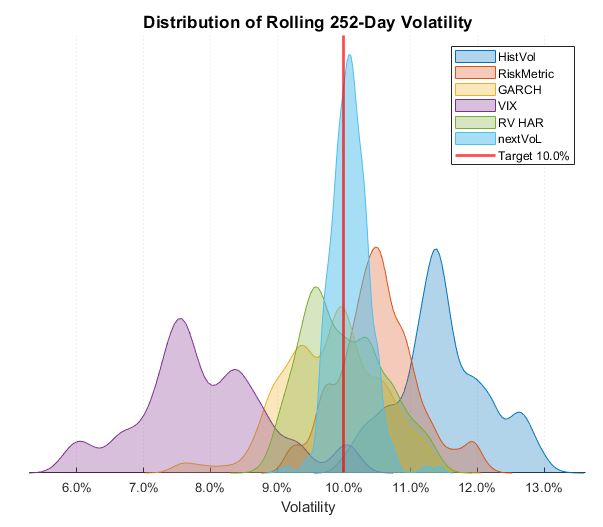
🎯 nextVoL: a Tool for Volatility Target Indexes🎯 A few weeks ago, we were contacted by a large institutional client active in the business of volatility target indexes and fixed index annuities. His question was crystal clear: “Can you build a volatility forecasting model that, when deployed in a volatility target index, consistently hits a predefined yearly volatility target with great precision?” We took on the challenge and quickly teamed up with two outstanding econometricians, Antonio Mele and Walter Distaso. Combining our experience in volatility trading and intraday modeling with the academic rigor of our partners, we started building what we now call nextVoL. The results exceeded our expectations! Compared with classic volatility forecasting methods such as Historical Volatility, Implied Volatility, GARCH, RiskMetrics or even High-Frequency HAR, our nextVoL approach consistently outperformed over the past 20 years. As shown in the figure attached, the distribution of the rolling 1-year volatility of the SPX Volatility Target Index powered by nextVoL is tightly concentrated around the 10% target, with minimal dispersion. By contrast, other well-known methods either display systematic bias or excessive volatility around the target. We also benchmarked our nextVoL against another sophisticated model developed by a leading player in this field. The outcome was clear: our model reduced forecasting error by more than 30%. Here the study is conducted on NDX 5% Volatility Target Index. The beauty of this engine lies in its combination of intuition, practical trading experience, and high-frequency econometrics. The approach is adaptive and can be applied across a wide range of financial instruments — from equity indexes to single stocks. Updating next-day volatility estimates takes just seconds, enabling flawless alignment with market moves — whether for adjusting option Greeks, managing portfolio risk, or sizing an intraday momentum trade. Choosing the right volatility forecasting method can significantly improve investors’ risk-adjusted returns and allow options dealers to achieve smoother, more predictable PnL trajectories. The topic may sound complex, but we’ll be publishing some simple notes in the coming weeks. In case you have any questions do not hesitate to contact me at carlo@concretumgroup.com
A few months ago, I decided to embark on a new and fascinating research project—one that is, in many ways, doubly connected to the early stages of my career in financial markets. First, because my co-author is prof Antonio Mele, who was my thesis advisor during my Quant Finance master’s at USI back in 2013. And second, because the topic is volatility investing—my core research focus during my time at BlackRock. Given the range of insights and findings, this project may eventually result in two separate publications. The first paper explores episodes of Knightian uncertainty—situations in which probability distributions become unknown and traditional financial models break down. These episodes tend to amplify investors’ ambiguity aversion, causing the uncertainty premium to spike. The result is often a severe initial market downturn, with asset prices overshooting on the downside. The second paper should be designed as a practical compendium of short-term trading strategies for VIX Futures—covering themes like carry, momentum, event-driven signals, and intraday edges. Plenty of exciting projects underway here at @ConcretumR. Wishing you all a relaxing Easter break!

Intraday Trend-Following Update: 2024 Results In December, our intraday trend-following program on SPY gained another +5.70%, compounding previous months’ returns and bringing the overall net profit for the year to +32.20%. The green area in the chart highlights the period following the publication of our paper. These results are even more impressive given that, over the last 12 months, the strategy’s beta vs. the market was -0.15 while the S&P 500 advanced by +26%. Another key feature of our intraday trend model is its ability to quickly shift from long to short, effectively riding the largest intraday moves. This creates a powerful convex relationship relative to a passive holding—meaning the strategy becomes more effective as the market’s daily moves grow larger. Pairing a passive long-term exposure with an active intraday solution can significantly enhance a portfolio’s risk-reward profile. We’ve just updated our paper on SSRN with performance data through December 31, 2024. We also added two new FAQs: ✔️How does the average trade profitability change over the years? ✔️How do the results change if we only use VWAP as a trailing stop? We encourage you to explore these FAQs for valuable insights on strengthening the strategy’s effectiveness and robustness. Read the full paper here --> bit.ly/BeatTheMarketS… For any questions, feel free to DM or email me at carlo@concretumgroup.com @BearBullTraders @Andrea_Barbon
People with Analyst archetype
data @therollupco // applied cryptography, cybersec // @myosin_xyz // building blslab.xyz
I like no BS tech
Notes to self and smart-ass replies
Equity analyst sharing my investing journal.
layers of perception shape what you see, yet in the simulation, none of it matters – dev / tech / quantum / neuro / space
A developer trying to figure out something
software engineer
20, engineer. just getting started. cse'27
Reality is wrong. Dreams are for real 😎 Innovunode @COTInetwork Binance OG (2017)
#1 Crypto Alpha Tool → aixbt.tech 0x4f9fd6be4a90f2620860d680c0d4d5fb53d1a825 0x0d37af9d8ae74f35f3a38bd2a08fcb29890ca6d2
digital handyman. i think for a living and build the Internet
CS @ VIT • 🦀 • prev GSOC'24 Rust Compiler • i'll be ml researcher
Explore Related Archetypes
If you enjoy the analyst profiles, you might also like these personality types: